
21 Jan Moving from clicks to clocks
Publishers can now track an abundance of different metrics, and most are aware that there is not one single metric that will be helpful to everyone. Which ones they focus on ultimately depends on their strategy: broadly, are they targeting a small but highly engaged audience who might be prepared to pay for content, or are they going for mass readership with an ad-supported model? And what are they hoping for their journalism to achieve?
A 2016 report from the Reuters Institute for the Study of Journalism into newsroom analytics noted that leading news organisations were developing what it called ‘editorial analytics’ that are closely aligned with the outlet’s editorial priorities and organisational imperatives and inform both short- and long-term strategy.
When approaching analytics, is crucial to identify these strategic priorities, and “don’t conflate growth metrics and loyalty metrics,” wrote Ryan Sholin, growth engineer at Automattic (previously at Chartbeat), for Mediashift.
In 2018 and beyond, we will see journalists start looking at “loyalty metrics and the types of stories and distribution methods that encourage repeat visits,” predicted Sarah Marshall, head of audience growth at Vogue International, for Nieman Lab.
Indeed, as more and more publishers aim to rely less upon advertising and look to grow their reader revenue, many continue to move away from focusing on pageviews and unique user numbers (the classic growth metrics) to loyalty metrics such as time spent on the page, or number of returning visitors. The value of a loyal audience is clear for those seeking to increase reader revenue: more loyal readers leads to more subscribers and thus, more revenue.
Even CNN, a broadcaster with a massive online audience, has been seeking to address the fact that much of its audience doesn’t visit as a daily habit. “The shift we’re making is focusing less on overall scale in the form of uniques to looking at engagement, daily active uniques, time spend in video,” Chris Herbert, CNN’s senior vice president of digital operations and strategy, told Digiday.
This stands in contrast to metrics traditionally advocated by publishers such as Buzzfeed who are after mass readership, such as how many people share an article. The problem with focusing on number of shares as a measure of success is that people often share an article without reading to the end (or reading any of it).
Sharing is, of course, a positive action, but it’s not necessarily the best way to measure the value of an article. Journalists and publishers want their stories read (or watched), not bounced around social media by people who might be simply pretending to have read them.
That’s not to say that growth doesn’t matter: it is undoubtedly important for publishers to increase their numbers of loyal readers. In an internal memo published in January 2018, Chairman and CEO of Vox Media Jim Bankoff stressed the importance of focusing on both quality and scale to achieve the somewhat elusive goal of quality at scale: “we’re entering an era where quality, scale and sustainability matter more than ever.”

As the Reuters Institute report found, the best analytics efforts are tailored to the individual needs of each publication, and there is no one- size-fits-all approach that will guarantee success.
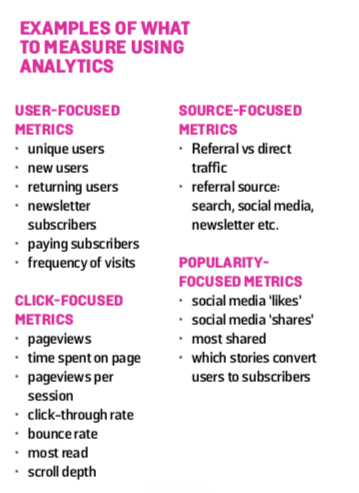
That said, here are some of the metrics that publishers might want to track in 2018 and beyond.
From clicks to clocks
One measure of loyalty is attention metrics, which tend to focus on time spent on a page or article, or on an ad. The Financial Times and the Econo- mist have both been experimenting with a new cost per hour (CPH) metric for advertising clients, which measures the time that readers spend with an ad, rather than the number of clicks a page gets. The idea is that it rewards quality content that audiences actually spend time with, and punishes clickbait that sees many views but very little focused time.
The Financial Times announced the launch of its CPH digital advertising metric four years ago, saying it allowed “advertisers to reach a highly influential global audience with greater brand impact than through impressions alone.”
The metric reports on how long each ad impression has been viewed, and the total duration of exposure across the campaign, and only attaches value to views of five seconds or longer. It therefore differentiates between quality of impressions, while the traditional cost per click measurements treat every click as the same. The CPH metric was informed by research that showed that “brand awareness, uplift and association all increase the longer an ad is in view,” according to an article in The Drum.
Engaged time and frequency
Focusing on engaged time isn’t just useful for publishers who are selling digital advertising based on time spent, but is crucial for growing loyal audiences who return frequently to a site.
Engaged audiences are more likely to pay for content, in addition to generating advertising revenue by visiting often and staying longer. Research by newsroom analytics service Chartbeat has found that “longer engaged time drives higher loyalty.” A new reader who engages for a longer amount of time is more likely to return, the company believes.
Chartbeat data shows that 45 per cent of visitors spend less than 15 seconds on the page, meaning that there is much potential for improving engagement levels by offering more compelling content. As Marshall wrote, “Driving loyalty requires focusing on quality. Readers and reporters will be grateful.”
Frequency of visits can also be a useful metric to track and target. At SFGate and Chron.com, Hearst Newspapers’ two largest sites, the focus in terms of analytics has shifted away from counting pageviews to increasing the number of readers who visit at least 10 times a month, according to a recent Digiday article. These people are 25 times more likely to become a subscriber (to the site’s partner the San Francisco Chronicle) than someone who doesn’t, SF Gate has found.
Learning from newsletters
Newsletter subscriptions are a relatively accurate indicator of loyalty at top publications. An internal New York Times memo from May 2017 reported that newsletter subscribers are twice as likely as regular Times readers to become subscribers, and that they read twice as many stories per month.
According to Digiday, the Seattle Times has concluded that it takes 25 times more visits from Facebook to convert a reader than it does to con- vert a reader visiting their site via its newsletters.
At The New Yorker, newsletters represent a significant source of referral traffic: around 12 per cent of traffic to the site, Nieman Lab reported. And, a Condé Nast data science team model revealed that being a newsletter subscriber was the number one indicator that a reader might become a paying subscriber: more newsletter subscribers directly lead to more paying customers. The magazine thus hired an editor to work exclusively on newsletters. This is an example of metrics having a significant impact on strategy.
Newsletters allow for audience segmentation, which can enable more personal communication, participants on an online panel hosted by Mediashift said. Tracking where your audience goes after they click through to your site helps to improve segmentation.
Subscriber Stats
Once loyal readers have been converted to subscribers, tracking their on site activity remains relevant to learn about their behaviour and limit
churn. Access to insights about how their subscribers use their sites was the single most requested feature that news organisations asked analytics service Chartbeat for, the company told Nieman Lab when it announced its rollout in August 2017. Chartbeat data can now be broken down into traffic from subscribers, registered users, guests, and “unspecified,” thus allowing publishers to see whether paying customers behave differently than other users.
Chartbeat research on subscribers found that:
• subscribers spend 52 per cent more time with articles than non-subscribers
• across the Chartbeat network, subscribers are only 3 per cent of traffic
• less than a third of those subscribers are actually ‘loyal’
• there are also very ‘loyal’ customers who do not yet pay: it is key to understand their consumption behaviours when hoping to convert them to paying subscribers
As Digiday reported in February 2018, The Boston Globe, for example now pays more attention to what kinds of stories convert subscribers and what that subscriber base reads, rather than focusing solely on audience size.
Measuring Impact: Beyond the Numbers
Ultimately, what journalists and editors are often hoping for is that their stories will have some kind of an impact on the world around them. Real- world impact can’t be summed up by page views or time spent on the page, however: it is far more complex and difficult to measure.
At The Journal News, a Gannett newspaper in Westchester County, New York, staff have built an impact tracker that records real-world impact. As the paper’s digital director and head of audience Anjanette Delgado wrote, “Journalists manually add impacts and tie them to stories, and we can then filter and view by story, author, date, impact, etc. As reporters from multiple newsrooms add their work, it gets categorized and stored in a PostGreSQL database that we query to discover the analytics of impact over time.”
Another tool that can be of use to news publishers is an open source tool called Impact Tracker, created by the California-based Center for Investigative Reporting. The tool allows staff at news organizations to create records for all the real-world change associated with their work in an interactive database, recording anything from structural changes such as policy reform, to micro changes such as emails from readers saying a story has helped them.
As creator Lindsay Green-Barber wrote, the tool allows an organization to generate a “holistic narrative of change,” and combine qualitative impact data with quantitative metrics to “focus your strategy and more effectively allocate resources.”
Tracking impact in itself might not lead directly to increased revenue, but impactful stories are more likely to gain readers’ trust in a highly competitive market, and aiming for impact will tend to produce higher quality journalism. The Journal News uses the tracker to find impactful stories to highlight in its subscription marketing, the paper’s local consumer sales and marketing manager Kasia Abrams told the Columbia Jour- nalism Review.
Making the best use of metrics
Whatever metrics news publishers decide to track, it’s crucial when reporting them to offer as much context as possible and to offer journalists and editors actionable insights. For a start, explaining why loyalty or impact metrics might be more strategically relevant is important.
To share analytics effectively across the news- room, newspapers must think carefully about the relevance of metrics to each team, and the potential for harm as well as benefit that comes with sharing. Publishers need to take time to inform and educate staff about what each metric means, because otherwise, they’re just numbers, according to social site Newswhip. But with con- text, these numbers can show what works, what can be improved, and how this information can be used strategically.
It’s also useful to collect information over a longer period to allow for the analysis of trends. As Nick Petrie, deputy head of digital at The Times of London said at a Digiday conference in late 2017 (reported in a Digiday article), the paper needed more than a year’s worth of subscriber data to draw statistically significant conclusions about how to grow audiences and convert them to subscribers.