
16 Jan Make Data Part of Your News Culture
Many newspapers are experimenting with in-house analytics that attempt to integrate reader behaviour with newsroom production. INNOVATION takes a look at how to do it right.
There might not be one best way to use them, but there is little doubt about the need for using data analytics not only for journalism but also for organising the newsroom. The Washington Post, Axel Springer, BBC and Vox all use them to make decisions. Christopher Wiggins, the Chief Data Scientist at The New York Times, told Search Business Analytics that: “Data is more and more getting recognized at The New York Times as a first-class citizen”. Data analytics is not about definitive answers. It is the ultimate tool for making editorial and strategic choices.
The Reuters Institute for the Study of Journalism establishes the following three priorities when planning a data strategy:
- Define the “editorial priorities and the organisational goals”. It cannot be a secret. Everybody in the company needs to know, which might seem obvious but the weight of habit often leads to forgetting the fundamentals;
- Identify the data and metrics most useful for that end. Tons of data, without order or criteria, can only lead to confusion. Instead, define both the right real-time and curated metrics that allow you to appreciate the content that works with perspective. But these metrics can never be engraved in stone: they must evolve with the audience and the market;
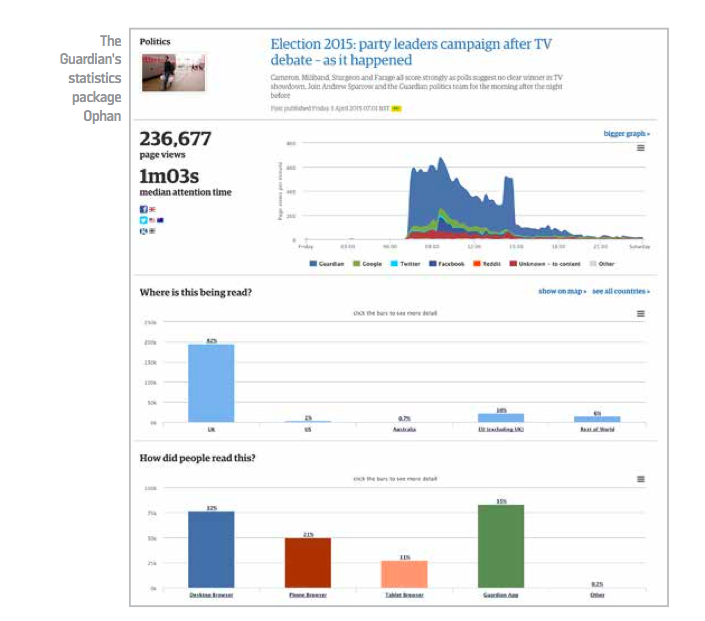
- “Develop tools, organisational structures and newsroom cultures” that will allow you to make well-informed short- and long-term choices. Data analytics is also about visualisation. This has been an obsession for companies like The Guardian with its tool, Ophan, and the Financial Times with Lantern. In order to be able to react to this information, a newsroom needs a structure that is free of old print-centric deadlines and that embraces and promotes an audience-first culture.
Meeting Market Needs
At the end of the day, it’s about achieving goals and being able to afford an agile, trial-and-error approach. To that end, data can be split into two categories: firstly, audience needs and how they interact with your content and brand; secondly, your chances of offering them what they want, when they want it and how they want it.
In the first category, there are some basic things you want to know: How many people have I reached and how many have I engaged? Where do they come from? When do they land in my universe? On which platforms do they consume my content? How long do they stay with me? Where do they go when they leave?
How does my audience interact with branded content or ads? And, most importantly of all: who are they? In the second category, we need to match our audience’s (ever-evolving) habits to our news-room organisation. How fast do we react to a sudden new topic of interest? Do we set the agenda or do we merely register facts? Is our planning system capable of producing content that works?
Combining both of these categories, we’ll be able to make sure that our content is well chosen, well planned, well produced and well distributed.
One of the first steps in integrating metrics in a newsroom is to make journalists aware of what is really happening. The editor of The Salinas Californian, Anjaneete Delgado, used a “Post and Readership Comparison Chart”. Recurrent and simple, yet very effective, it visualises when users consumed articles and when the newsroom was publishing them. Delgado realised that their main traffic peak was at around 8 a.m. but that they were publishing most of the content the previous evening, earlier even than the print deadline. The paper was still governed by print routines, while users were already on a different schedule.
Lantern & Ophan
Figuring out the right information opens a door towards new worlds with new possibilities, with a different logic than in the past. At some point, you need to step through that door and embrace what the data is telling you. Ask questions of the data, and interpret the answers correctly. That is just what the Financial Times did with Lantern.
Lantern overcomes initial digital instincts, relativising visits and page views to focus on engagement, itself a significant step forward in analytics culture. It needs the involvement of the whole newsroom in an effort to understand their relationship with users. Renée Kaplan, Head of Audience Engagement of the FT, said: “the goal of Lantern is simple: to bring data into the newsroom in a clear, practical way. Our aim is to demystify data and empower our journalists in real time. Understanding what stories are topical and relevant to different audiences will in turn lead to a better experience for our readers”.
Then, you should visualise that information, so that those unfamiliar with it can decode it at a glance. Answer simple questions with simple charts that allow journalists to understand the impact of their work. The Guardian created Ophan, which was well received by the newsroom. Ian Prior, The Guardian’s Head of Sport, told TechWorld that: “Tracking traffic on individual pieces of content impacts greatly on curation in that it allows us to target a popular article as a gateway to other content. It’s also invaluable in telling us where our users are and on what devices our content is being accessed. To use an up-to-date example, a very high volume of mobile traffic from the sub-continent to cricket World Cup content has probably led directly to an increase in the volume of our coverage from the tournament”.
Two Major Changes
Tools are fundamental but not enough. The Reuters study illustrates this. Two major changes are needed: culture and organisation.
It is not enough to create an analytics desk that spends its time writing reports that get lost in the day-to-day rush of news. The operation itself needs to understand that it needs to change the way it works. Every action the newsroom takes must ultimately serve to find and engage readers. Otherwise, journalists are working for the sake of their own egos and their content will have no impact at all. Stories cannot be conceived an stand-alone articles but should be thought of as global content capable of reaching and interesting audiences in different formats, platforms and narratives.
The cultural evolution leads to the second change: organisation. The world is inter- connected and so our desks cannot be silos that are unaware of what the rest of the newsroom is doing and how it reaches its audiences. In communication, the recipient is as important as the message. One cannot exist without the other. The organisation must adapt to its audiences’ behaviour, and learn about their habits to send them information when they want it. A newsroom should not try to break their habits and force readers to adopt its own.
INNOVATION’S TAKE
There is no excuse in 2016 not to be trying very hard to do data right, but getting it right is not as simple as measuring page views or knowing which countries readers access our sites from. The next level is trying to relate reader behaviour and habits to content and story insights and newsroom production. That is a much more difficult nut to crack. Success at analysing a complex whole product requires input from a range of editorial and corporate positions, and that means our news companies need to accept data as part of their culture.

This article is one of many chapters published in our book, Innovations in News Media 2016 World Report.