11 Mar METRICS: MEASURING WHAT MATTERS
There is a fear, even in academic literature, that newsrooms around the world are becoming more concerned about metrics and engagement rates, at the expense of the broader ‘public interest’ dimension of journalism. But metrics can offer invaluable insight and, if used wisely, they shouldn’t have a negative impact on a news outlet’s journalistic production.
There are clear risks associated with slavishly following metrics.
In addition to the risk of deprioritising content of civic importance, it’s not necessarily good for business. BuzzFeed and other digital-only startups that built businesses based on online sharing “yoked themselves so tightly to Facebook’s wagon,” argued Columbia Journalism Review’s Mathew Ingram, that when Facebook changed its algorithm, they lost unsustainable amounts of traffic.
A report by Kim Christian Schrøder, published by the Reuters Institute for the Study of Journalism, argues that regardless of what the metrics say, it is relevance that matters most to news consumers, and journalists should “trust their instincts rather than relying on the unreliable seismograph offered by ‘Most Read’ lists.”
Although people frequently click on entertaining stories with no obvious civic focus, “they maintain a clear sense of what is trivial and what matters,” he writes. While it is true that journalists should not abandon public interest news in favour of trivial content that might get more clicks, it is also true that, as The Guardian’s Chris Moran wrote, “Metrics, at their core, are simply measurements,” and, “… As journalists, we should never argue that ignorance is bliss.”
Analytical tools are being used in ever more complex ways, both in measuring the performance of stories and the levels of reader engagement. Increasingly, it is the latter that is more important to publishers as they hone their subscription models.
Many are developing engagement or loyalty scores that offer single figures that incorporate many different measurements. For example, the Financial Times’ RFV metric – which stands for ‘recency, frequency and volume’ – looks at the previous 90 days to see how recently a reader visited the brand’s site or social platforms, how many times they visited, and how much they read over that period.

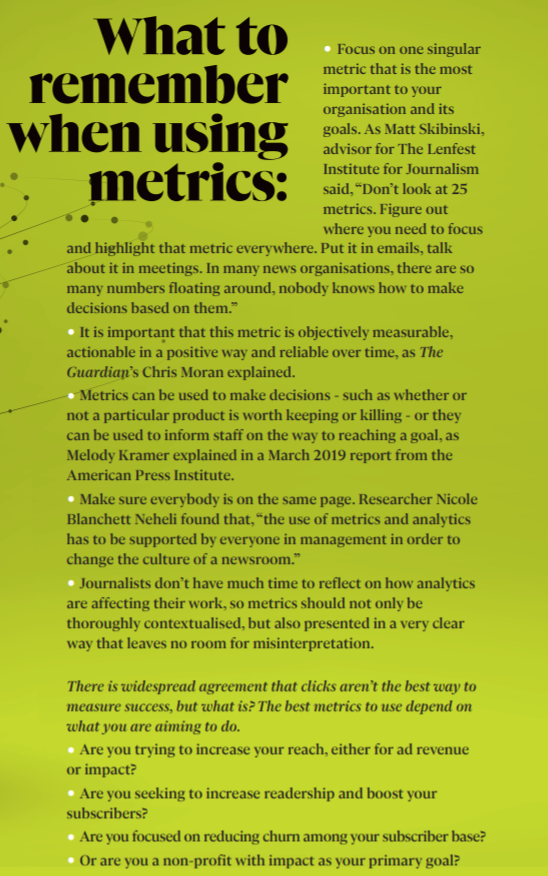
Here are some examples of the metrics that top news organisations are focusing on:
Primed for subscription

Publications seeking subscribers should use data to assess which website visitors are most likely to subscribe.
“The New York Times, for instance, has a model where we look for people visiting at least twice a week and looking at three different topics,” Charles Duhigg, New York Times columnist and senior editor, told the International News Media Association in December 2018.
This knowledge can be used to increase the effectiveness of marketing campaigns, and to increase overall subscription numbers.
Building a habit to reduce churn
A February 2019 study from Northwestern University’s Medill School of Journalism found that “one of the biggest challenges in digital news is replicating a print-news – paper level of customer loyalty by getting more visitors to adopt a daily digital habit.”
Encouraging a daily consumption habit is the goal of The Wall Street Journal’s analytics strategy. Its “engagement north star” is average active days (the number of days a reader engages with content,) according to WSJ’s Associate Director of Member Engagement, Anne Powell.
Paying users need to be active every day to not churn, Swedish local media group Mittmedia has found. According to a 2018 WAN-IFRA report, the publisher has developed a real-time user activity map that shows where users are active and where they are not.
“Once we were able to rally around a single metric, we developed a strategy that effectively drives habit and, in turn, increases average active days,” Powell wrote on INMA’s site.
This affords editors the chance to respond to low activity levels by making sure there is sufficient content in that area, or by increasing the volume of push alerts sent to users in those areas. Active users increased from 55% to 60-70% shortly after Mittmedia’s user activity map was launched.
Story performance beyond the simple page view
In an example of metrics being used to more accurately assess story performance, Digiday explained in early 2019 that the Financial Times was using a new metric called ‘Quality Reads,’ which shows the percentage of page views where the reader has read at least half of the article.
This is estimated by time spent on the page, scroll depth, and what it knows about the subscriber’s interactions with similar content. FT’s news desks are fed this information about their stories on a weekly basis.
According to TechWorld, The Times of London has created a metric called ‘Dwell Time Index,’ which includes measurements like dwell time and unique users visiting its articles. The Dwell Time Index also accounts for things like article length and positioning on the page.
The new metric scores each article out of 200, with 100 being an average performance. Anything scoring above 180 is considered exceptional compared to similar articles of its length and positioning.
Stop doing what readers don’t want
The USA Today Network built a tool called ‘Pressbox’ to show its journalists how their stories are doing, based not just on pageviews but on “volume, engage time, and loyalty (return frequency),” Nieman Journalism Lab reported.
In using this tool, they were able to determine that the lower-scoring half of their content was read by only six per cent of their audience.
This allowed staff to develop a strategy to replace this lower scoring content with the kind of journalism that readers would want to read. As a result of these insights, the network is now publishing less digital content, but garnering more page views.
Real-world impact
Real-world impact measurement has traditionally been the arena of non-profit news organisations, as showing that their journalism makes a difference is particularly important when they seek donations. As more and more news organisations seek to become subscriber-supported businesses, this need to prove value might become more widespread.
A tool called ‘Impacto,’ developed by International Center for Journalists (ICFJ) Knight Fellow Pedro Burgos, was recently used by six publishers in Brazil to identify when they have helped to shape policy changes and opinions.
The platform searches sessions from municipal, state and federal legislative chambers for mentions of the news outlet, as well as combing social networks, blogs, news sites and academic research for the same information.
According to ICFJ, one of the newspapers using Impacto, for example, maps every instance of impact so that if a reader calls to cancel a subscription, staffers can check the map and tell the caller how the paper has improved the quality of life in that person’s neighbourhood.
“One way to regain the trust of our audiences — and potential audiences — is to show them that journalism plays a vital role in making their lives better,” wrote ICFJ Vice President Patrick Butler in his 2019 Nieman Lab prediction.
This article, along with many, many more is available in full, within the pages of our Innovation in News Media 2019-2020 world report, available for purchase in print or digital edition.


